In this blogpost, I’ll run through an example of how to configure a monitor from the ground up, going through every step, for making a monitor in Powershell for SCOM. It’s a very basic script, but it have a value we measure on, so you have all the basic building blocks. But first…
What time is it? ADVENTURE TIME!
The other day I was transferring an OS Image to one of our new Hyper-V servers, and the transfer speed was around 10 Mbit on our internal network. Asking the guy responsible for the server if there was something wrong, and the answer was immediately “YOU!”… Well, it turned out that there was something more behind it. We did some diagnostic, and one of the network cards was only working at a very low speed, and since the NIC was teamed, I was just unlucky getting connected on the slow NIC. So how do we take those kind of problems before they grow into larger problems? We monitor our NICs and the speed on the combined team.
So we have 2 NICs in our physical servers, those 2 are combined into a NIC Team, and since they are 1 Gbps we know the combined linkspeed should be 2 Gbps.
Getting the speed of the NIC Team in Powershell
If we run the following line on the server in Powershell:
Get-NetAdapter -Name CTLAN-TEAM | select LinkSpeed
We get the following response:

This is what we want, this is the healthy state. However, when we want to do a comparison in SCOM, we don’t want the header included, so we want to run the following line:
Get-NetAdapter -Name CTLAN-TEAM | select LinkSpeed –ExpandProperty LinkSpeed
So now the reply is:
![]()
Configure a monitor in SCOM using Powershell script
Now let’s configure a monitor in SCOM with our simple Powershell script. Firstly, if you don’t already have the “Sample Management Pack”, which is used for creating Powershell script in SCOM, go ahead and download and install that first. It can be fetched from here: https://gallery.technet.microsoft.com/Sample-Management-Pack-17b76379
- Open SCOM
- Click on Authoring
- Click on “Monitors”
- Right-click and select “Create a monitor” -> “Unit monitor”
- Expand: “Scripting”->”Generic”->”Sample Powershell Script 2 State Monitor”
- Select a management pack for it, or create a new one. Usually I’ll create a new management pack since it’s easier for an export to a customer and easier to pick out a package/function.
- You should now end up on the first page in the “Sample Powershell Script 2 State Monitor” as pictured below:
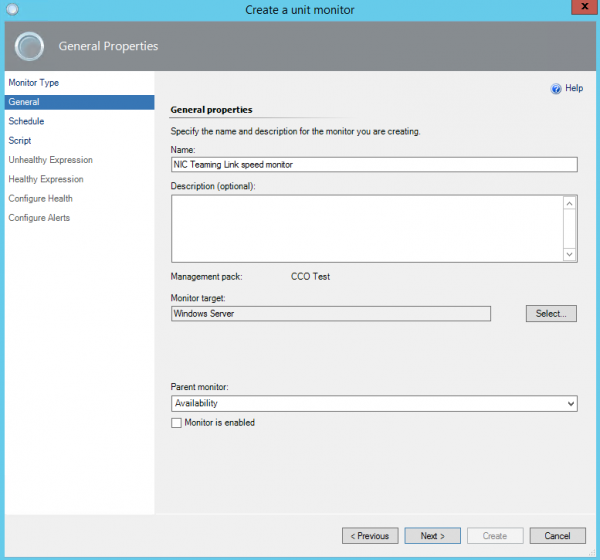 Let’s rundown through the different fields. Name is what the monitor will be called when we’re looking for it in SCOM. Monitor Target is the target for the monitor, since we want to monitor our Windows Servers. Parent monitor is the 4 different overall monitors: Availability, Configuration, Performance and Security. For this select: Performance, since we want to measure the performance of the NICs in the server, since that what’s dropped from 2 Gbps to 1.01 Gbps. And one final important step, remove the checkmark in: Monitor is enabled. We want to disable the monitor, since it’s rare that we want a monitor to run on all instances of a target. This might sound counter-intuitive, but instead we want to do an override, especially when testing a new monitor, so we only enable it on a very specific amount of servers.
- In the next step “Schedule”, we specify how often we want the monitor to run, 15 minutes should be sufficient for this type of monitor.
- Now in the next step, we insert the actual script:
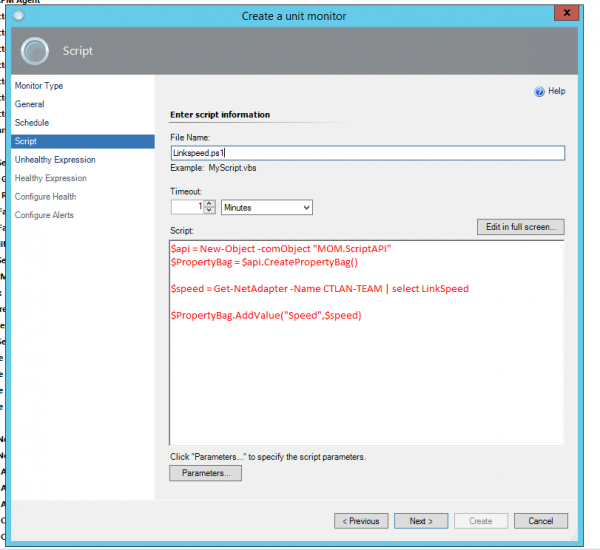 Okay, let’s run through the script:
$api = New-Object -comObject “MOM.ScriptAPI”
$PropertyBag = $api.CreatePropertyBag()
$speed = Get-NetAdapter -Name CTLAN-TEAM | select LinkSpeed -ExpandProperty Linkspeed
$PropertyBag.AddValue(“Speed”,$speed)
$PropertyBag
The first two lines:
$api = New-Object -comObject “MOM.ScriptAPI”
$PropertyBag = $api.CreatePropertyBag()
These lines create a “propertybag” which can be used for transfering information back to SCOM.
The next line:
$speed = Get-NetAdapter -Name CTLAN-TEAM | select LinkSpeed -ExpandProperty Linkspeed
This is the command we tried earlier, we just write the result to the variable $speed.
Next we have the following lines:
$PropertyBag.AddValue(“Speed”,$speed)
$PropertyBag
First we add the value from the variable $speed to our propertybag in a field called: “Speed”. Next we just transfer the fields and values from PropertyBag back to SCOM so we can perform test on the values.
- Let’s go on to the next step, we want to specify what an unhealthy expression look like for SCOM.
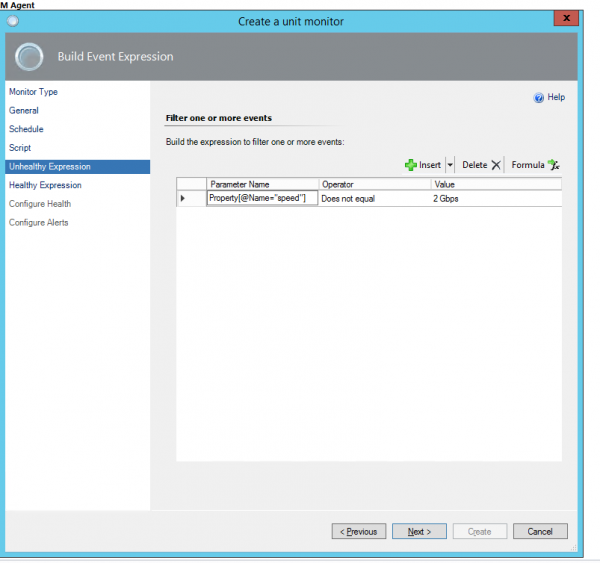
Here the tricky thing is the parameter name, to refer to the field speed, we use the following command:
Property[@Name=”Speed”]
When the value of the field Speed is not equal to 2 Gbps, then the NIC team is an unhealthy state.
-
On the next page we specify that a healthy state for parameter: Property[@Name=”Speed”] is when it’s equal to 2 Gbps. So now just “Create” the monitor.
Overriding a monitor
Now we actually want to use the monitor on a server. So we create an override:
- Navigate to: Authoring -> Management Pack Objects -> Monitors
- Search for the monitor name.
-
Right-click on the monitor and select: Overrides -> Override the Monitor -> For a specific object of class: Windows Server. See the image below:
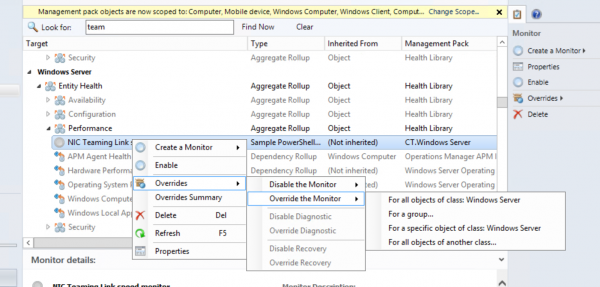
- Now, change the value of enabled to true, and now the monitor is activated for the specific object you selected:

So now, you have a simple monitor for SCOM which uses a Powershell script.
In case you were wondering, >someone< used a defective cable in one of the NICs.

Thanks for creating this article!
I created a powershell configuration monitor, targeted it to the group of servers I want to monitor, enabled it and put in the override as you depict. After that I am expecting that when I go to monitoring, double click on one of the servers in my target group I am expecting that monitor to show up under Entity Health-Configuration-(New configuration monitor). It’s not though and I’ve been banging my head against this all afternoon. Figure I’m missing something really simple.
Thanks for your help!
I cant target monitor to group. You should override it to group
Figured it out…
Trying to apply this method to an Azure PS script
PS C:Windowssystem32> Get-AzureRmResource -ResourceGroupName xxx -ResourceType Microsoft.Network/expressRouteCircuits -ResourceName XXXX -ApiVersion 2016-09-01 | select Properties
Properties
—————–
Enabled
Try to apply this to your example – and i just want a healthy alarm if the result is enabled and Critical if anything else
$api = New-Object -comObject “MOM.ScriptAPI”
$PropertyBag = $api.CreatePropertyBag()
$status = Get-AzureRmResource -ResourceGroupName xxx -ResourceType Microsoft.Network/expressRouteCircuits -ResourceName -ApiVersion 2016-09-01 | select Properties
$PropertyBag.AddValue(“Status”,$status)
$PropertyBag
i then add unhealthy if enabled not present and healthy is present.
Added the Monitor to the Azure Resource monitor under availabilty.
I can’t see anything – no monitor.
A folder is created in the monitoring pane and i added a status view – but nothing.
How to troubleshoot the script and where does it log errors ?
cheers.
Where are errors logged? Should I add language to the script to log errors to a file somewhere?
Does this really work ?
I created the same way as you did, But it does not work.
I have the screenshots uploaded in the below link,
https://social.technet.microsoft.com/Forums/en-US/67a736d8-e90d-4794-b4b0-163bcc9f4c02/newly-created-2-state-script-based-monitor-does-not-work?forum=operationsmanagerauthoring
I get this event id on the computer where it executes:
Event id: 21405
he process started at 22:40:14 failed to create System.PropertyBagData, no errors detected in the output. The process exited with 1
Command executed: “C:Windowssystem32cscript.exe” /nologo “Servicemon.ps1”
Working Directory: C:Program FilesMicrosoft System Center 2012 R2Operations ManagerServerHealth Service StateMonitoring Host Temporary Files 9351099
One or more workflows were affected by this.
Workflow name: UIGeneratedMonitor3180f81488dc48bb82aed10cc3ee6f3a
Instance name: MymanagementserverFQDN
Instance ID: {7763C0F5-60AA-362A-4225-5D45C89E21BB}
Management group: MYMG
Any one knows whats wrong.
j’avais un grand plaisir car j’ai visité ce blog. Bonne continuation.
This is not working
the script didn’t worked – got this in the ops eventviewer:
event:11904
The Microsoft Operations Manager Expression Filter Module failed to query the delivered item, item was dropped.
Property Expression: Property[@Name=”param”]
Error: 0x80004005
One or more workflows were affected by this.
Workflow name: UIGeneratedMonitor8f720f239f4d41da95cee0622188c8bc
Instance name: node.xx.yy
Instance ID: {E3BD4528-3D82-10F5-EAEE-A00D4C3C3FB4}
Management group: xx
SOLUTION:
change the quotes in the unhealthy and healthy from dobbel to single quotes
Property[@Name=’param’]
And the it worked 🙂
Not working, and the reason is that every SCOM monitor executes this command against the script:
Command executed: “C:\Windows\system32\cscript.exe” /nologo “scriptname.ps1”
and of course cscript cannot execute a powershell script.
So I have this error (and I was sure of this)
The process started at 2:24:59 PM failed to create System.PropertyBagData, no errors detected in the output. The process exited with 1
Command executed: “C:\Windows\system32\cscript.exe” /nologo “scriptname.ps1”
Working Directory: C:\Program Files\Microsoft Monitoring Agent\Agent\Health Service State\Monitoring Host Temporary Files 19\1716\
One or more workflows were affected by this.
Workflow name: UIGeneratedMonitorb45cf4dc3476474e8bcc562ca28df941
Instance name: servername
Instance ID: {DE2285C1-9EA8-DB03-DEA1-9D56E0A3341F}
Management group:
Très bon article! Merci pour cet article.
Je vous remercie pour le partage d’informations.
Un article bien intéressant
The article is in english, most comments are in english so why to these french people insist commenting in french;. just irritates me
yea this doesn’t work, the site is probably a scam
Très bien, this works like a charm! Remember to install the powershell sample MP linked at the beginning! Best scam evar! Thank you CoreTech