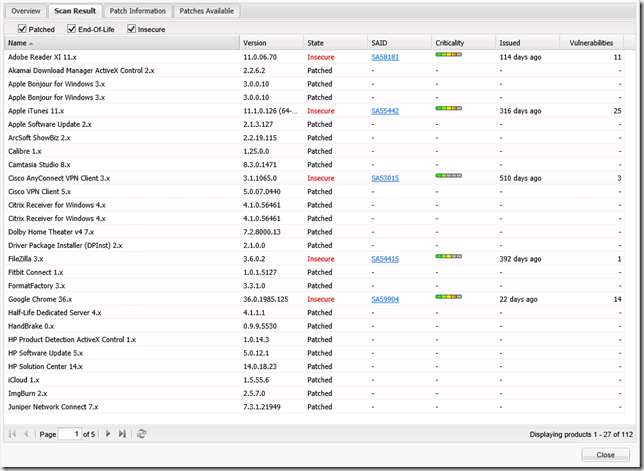
This is the 3rd and final post in my series of Secunia CSI and System Center 2012 Configuration Manager integration. Part 1 focused on installing and configuring, Part 2 focused on deploying and installing 3rd party software updates. This blog post will introduce you to the monitoring options in the product. You can monitor compliance in either ConfigMgr or in Secunia CSI. The difference between the two is ConfigMgr will only show you compliance about the updates you have published to WSUS where CSI will list compliance for all applications found on the systems.
Tracking compliance in CSI
In CSI you can create custom dashboards and/or reports both will provide you with up-to-date compliance data. You also have the ability to create Smart Groups. A Smart Group is a logical grouping of advisories or computers based on user defined criterias like “list all advisories where a zero days exploit
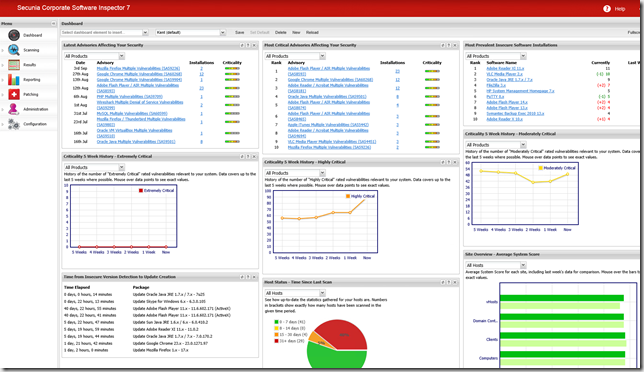
The dashboard
The dashboard can be customized and provide you with an overview of “the state of the uniion”. One of the biggest challenges improving the overall compliance is knowing where to begin. Personally I look for three things:
- Most critical updates
- Most prevalent insecure updates
- Latest Advisories affecting my systems
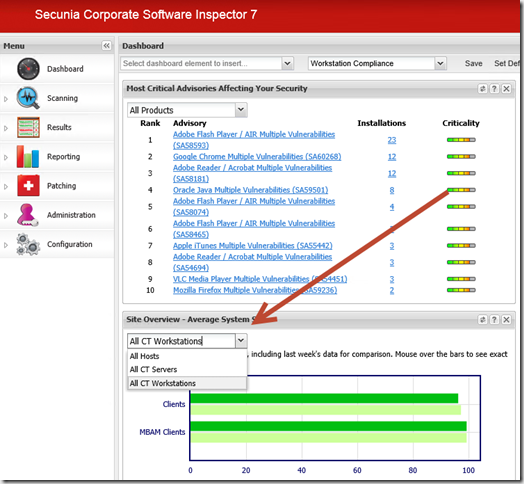
You can create multiple dashboards and each dashboard can later be added to a custom report. This makes perfectly good sense if you have teams in the organization that are only concerned about server compliance or workstation compliance on the East coast. To create a custom dashboard follow these simple steps:
- Open the Secunia CSI portal and navigate to dashboard.
- Click New and create a new Dashboard profile
- From the drop down list in the upper left corner, select the items you want to present (In this example I want to see Most critical updates, Most prevalent insecure updates, Latest Advisories affecting my systems and Average System score for all Workstations).
- In order to see the Average System score for All Workstations, select the Site Overview – Average System Score element. In the dropdown select the OU containing All Workstations. Notice this feature requires that you have installed the Daemon Service and configured Active Directory integration.
- Save the Dashboard
Custom reports
A custom report can include multiple security elements like general security concerns and concerns impacting your specific environment. In any report it’s important that you can tell what to patch and where to patch in order to become secure and equally important to stay secure. When I speak to Security Manager about what to patch, I often find that the Manages don’t take my advice serious when I tell them what insecure products they have. Instead if I tell them that they have software installed on 15,500 machines where hackers can get System Access from Remote most Managers start to lesson. Below is an example on how you create a reporting recipient and create a custom report.
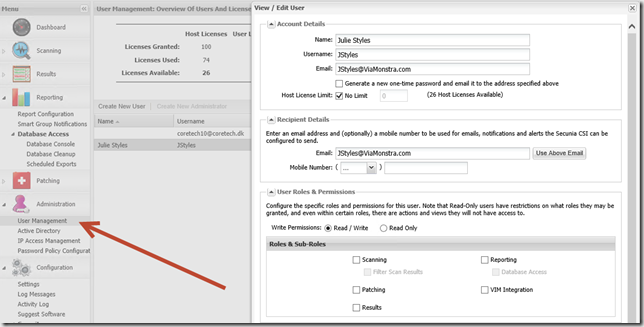
- In the CSI console navigate to Administration, User Management and click Create New User.
- Configure the user with a unique user name and email address. Notice the user do not need any role in order to receive reports. Roles are only required to work in the console.
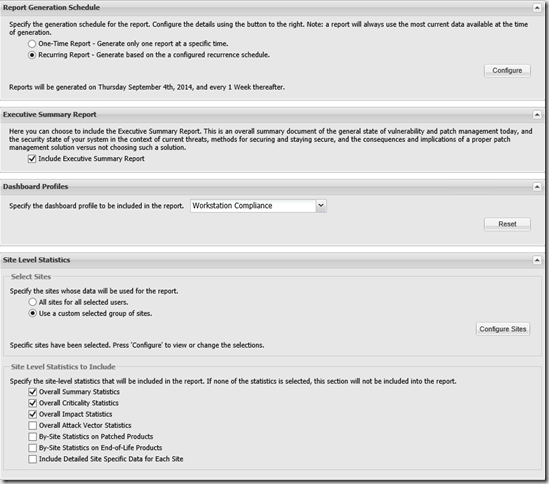
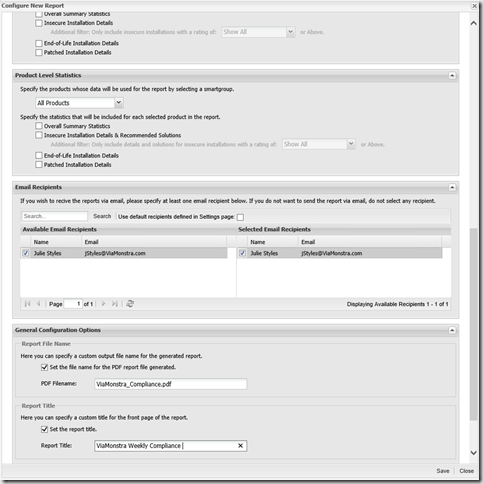
- In Reporting select Report Configuration and click Generate New Report. When creating the report I often see administrators select all the options – You want my Advice? Don’t do that as it will generate a report with several hundred or even thousand pages. I have only done it a couple of times – when I had a Security dude asking to many annoying questions

- In my example I have created a weekly report, included Executive Summary, my Workstation dashboard, selected two custom sites (organizational units). Notice that I do not select details for each host we have.
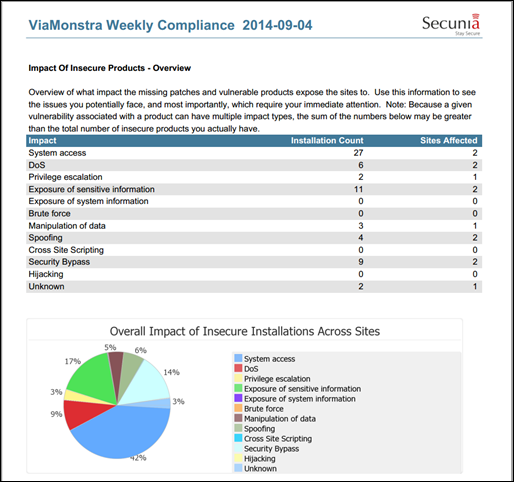
- One of the elements in the report is showing the impact of insecure products. This is the essence of staying secure. Forget about specific products and don’t become one the lazy administrators who only focus on Java and Adobe Reader. Focus on the impact, get secure and stay secure.
Smart groups
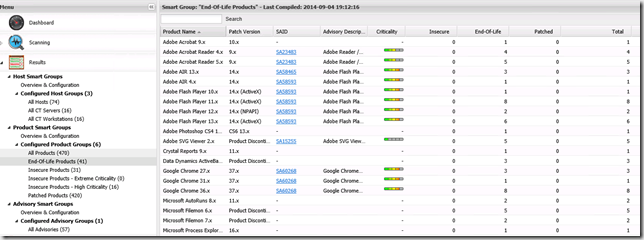
A Smart Group is a group of objects based one or more criteria’s eg. all computers in a specific OU, all computers affected by a System Access impact etc. There are three different kinds of Smart Groups, Host, Product and Advisory. CSI ships with some predefined Smart Groups that can be used as inspiration for creating your own custom groups.
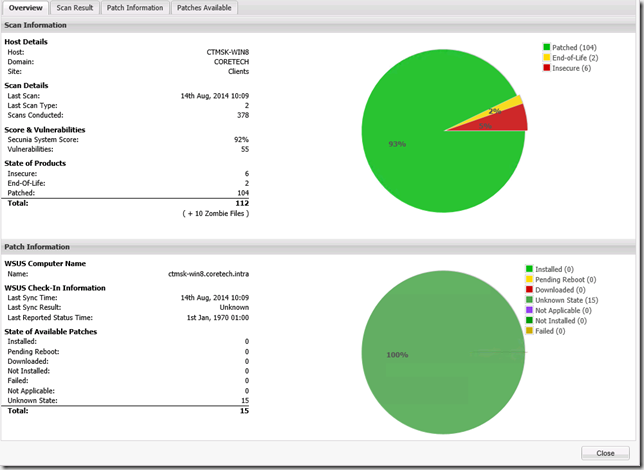
When navigating in the different Smart Group you’ll notice that you can drill into more details about each object. If you double click a computer object in the Host category you will be able to see specific details about the host, like missing updates, installed updates and other related OS information.
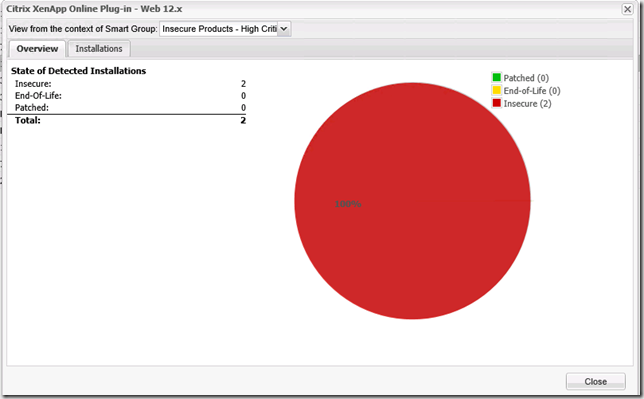
For objects in the Product category you will see information about the specific product, number of hosts where the updates is required and installed.
Creating your own custom Smart Group
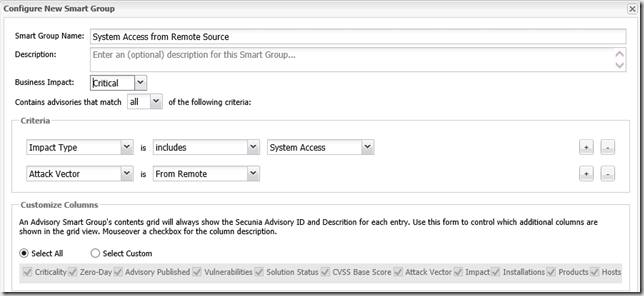
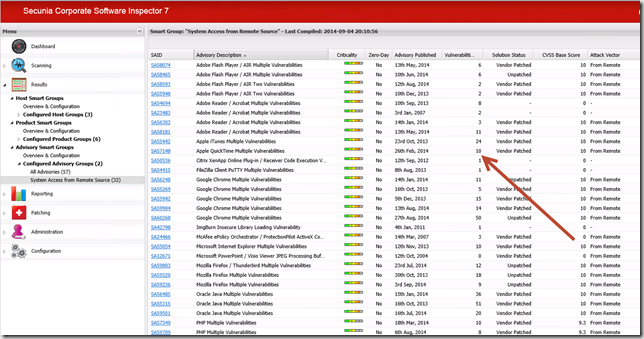
To create a Smart Group follow these steps below. The example will create a Smart Group listing all Advisories where the Impact is System Access from a Remote Source. The idea with the Smart Group is to be alerted when a new Advisory is detected in the system. By having knowledge we can stay secure.
- Navigate to Results, Advisory Smart Group, Overview and Configuration.
- From the Menu, click Create New Smart Group and configure a Smart Group with these properties:
Impact Type Includes System Access
Attack Vector Is From Remote - Once the Smart Group is created it will list the number of objects matching your criteria’s. In my example below, ask yourself the question if it’s only necessary to patch Java and Adobe Reader!
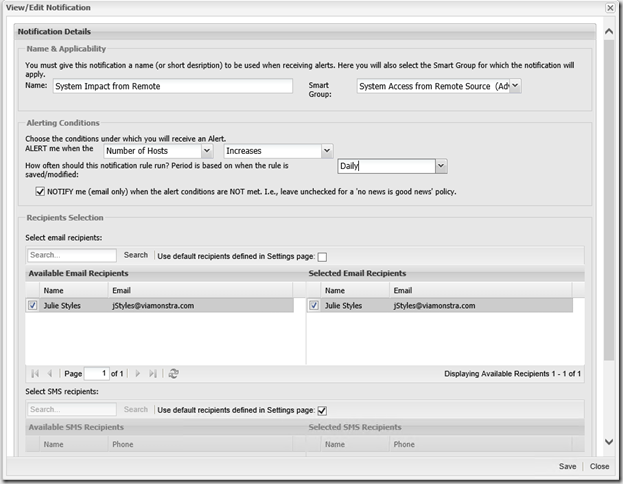
- Final step in the process is to mail enable notifications about any change in the number of Advisories. Navigate to Reporting, select Smart Group Notification and click Configure New Notification.
